Pigment

Pigment’s planning & automation

Pigment

Abstract shapes in orange, blue, and pink on a black background.

Pigment is a business planning and forecasting platform designed to help companies manage financial and operational data in real-time.  It’s often used for scenario planning, budgeting, and revenue forecasting, offering a more dynamic alternative to traditional spreadsheet-based planning.

Pigment’s use cases span:

Finance

HR

Sales & Revenue

Supply Chain

Turn complexity into confidence with Pigment

Leverage Pigment’s dynamic reporting tools, to illustrate your organisations explanatory data insights on a unified dashboard.

Some more examples of Pigment’s dashboards include:

  • Budget planning & forecasting

  • Financial consolidation

  • Sales forecasting

  • Territory & quota planning

  • Supply & operations

  • Revenue growth management

  • ESG performance

  • P&L, cashflow & balance sheet

  • Headcount planning

  • Sales capacity planning

  • Account scoring & segmentation

  • Demand & inventory planning

  • Product profitability analysis

A digital dashboard displaying ESG performance metrics for 2030 targets, including sections on climate change, workers' health and safety, corruption risks, energy mix, training, CSR suppliers, waste management, gender diversity, and human rights, with charts and data visualizations.

How can Pigment help with my business?

  • AI-Powered Planning & Forecasting
    • Scenario Modelling – AI helps simulate different business scenarios, allowing teams to anticipate risks and opportunities
    • Predictive Insights – AI-driven analytics provide real-time insights into financial trends and market shifts
    • Automated Forecasting – Reduces manual errors by automatically generating financial and sales forecasts based on historical data and trends
  • Automation for Efficiency
    • Data Integration – Connects with multiple data sources (ERP, CRM, HR, and finance tools) to ensure real-time updates
    • Workflow Automation – Eliminates repetitive tasks, such as updating spreadsheets and reconciling data, saving time for finance and sales teams
    • Error Reduction – Ensures data accuracy by minimizing human input errors in complex financial models
  • Real-Time Collaboration & Decision-Making
    • Live Data Updates – Teams can work with real-time numbers instead of outdated reports
    • Cross-Departmental Alignment – Sales, finance, and HR can collaborate on the same platform, ensuring unified planning
    • Custom Dashboards – Visual reporting tools allow stakeholders to track KPIs and business performance in a clear, intuitive format
  • Scalable & Adaptive Planning
    • Flexible Forecasting Models – Adjust models easily to account for market changes or internal shifts
    • Scalable for Growth – Works for startups and large enterprises, adapting to business needs over time
    • Compliance & Security – Ensures data privacy and governance, making it reliable for financial planning

Learn why Dresner ranks Pigment #1 for Agentic AI in enterprise performance management

Pigment has been ranked #1 for Agentic AI in enterprise performance management by Dresner Advisory Services in their inaugural Wisdom of Crowds Report.

With strong adoption already across IT, operations, sales, marketing, and finance, Pigment leads the pack in delivering practical, cross-functional AI-driven planning solutions, cementing its position ahead of competitors as the go-to platform for the next generation of intelligent enterprise performance management.

Pigment’s Analyst Agent has arrived

From September 10th, 2025, Pigment’s Analyst Agent is available to all customers. This specialised AI agent competently produces analytical reports, eliminating the manual work required to create them.
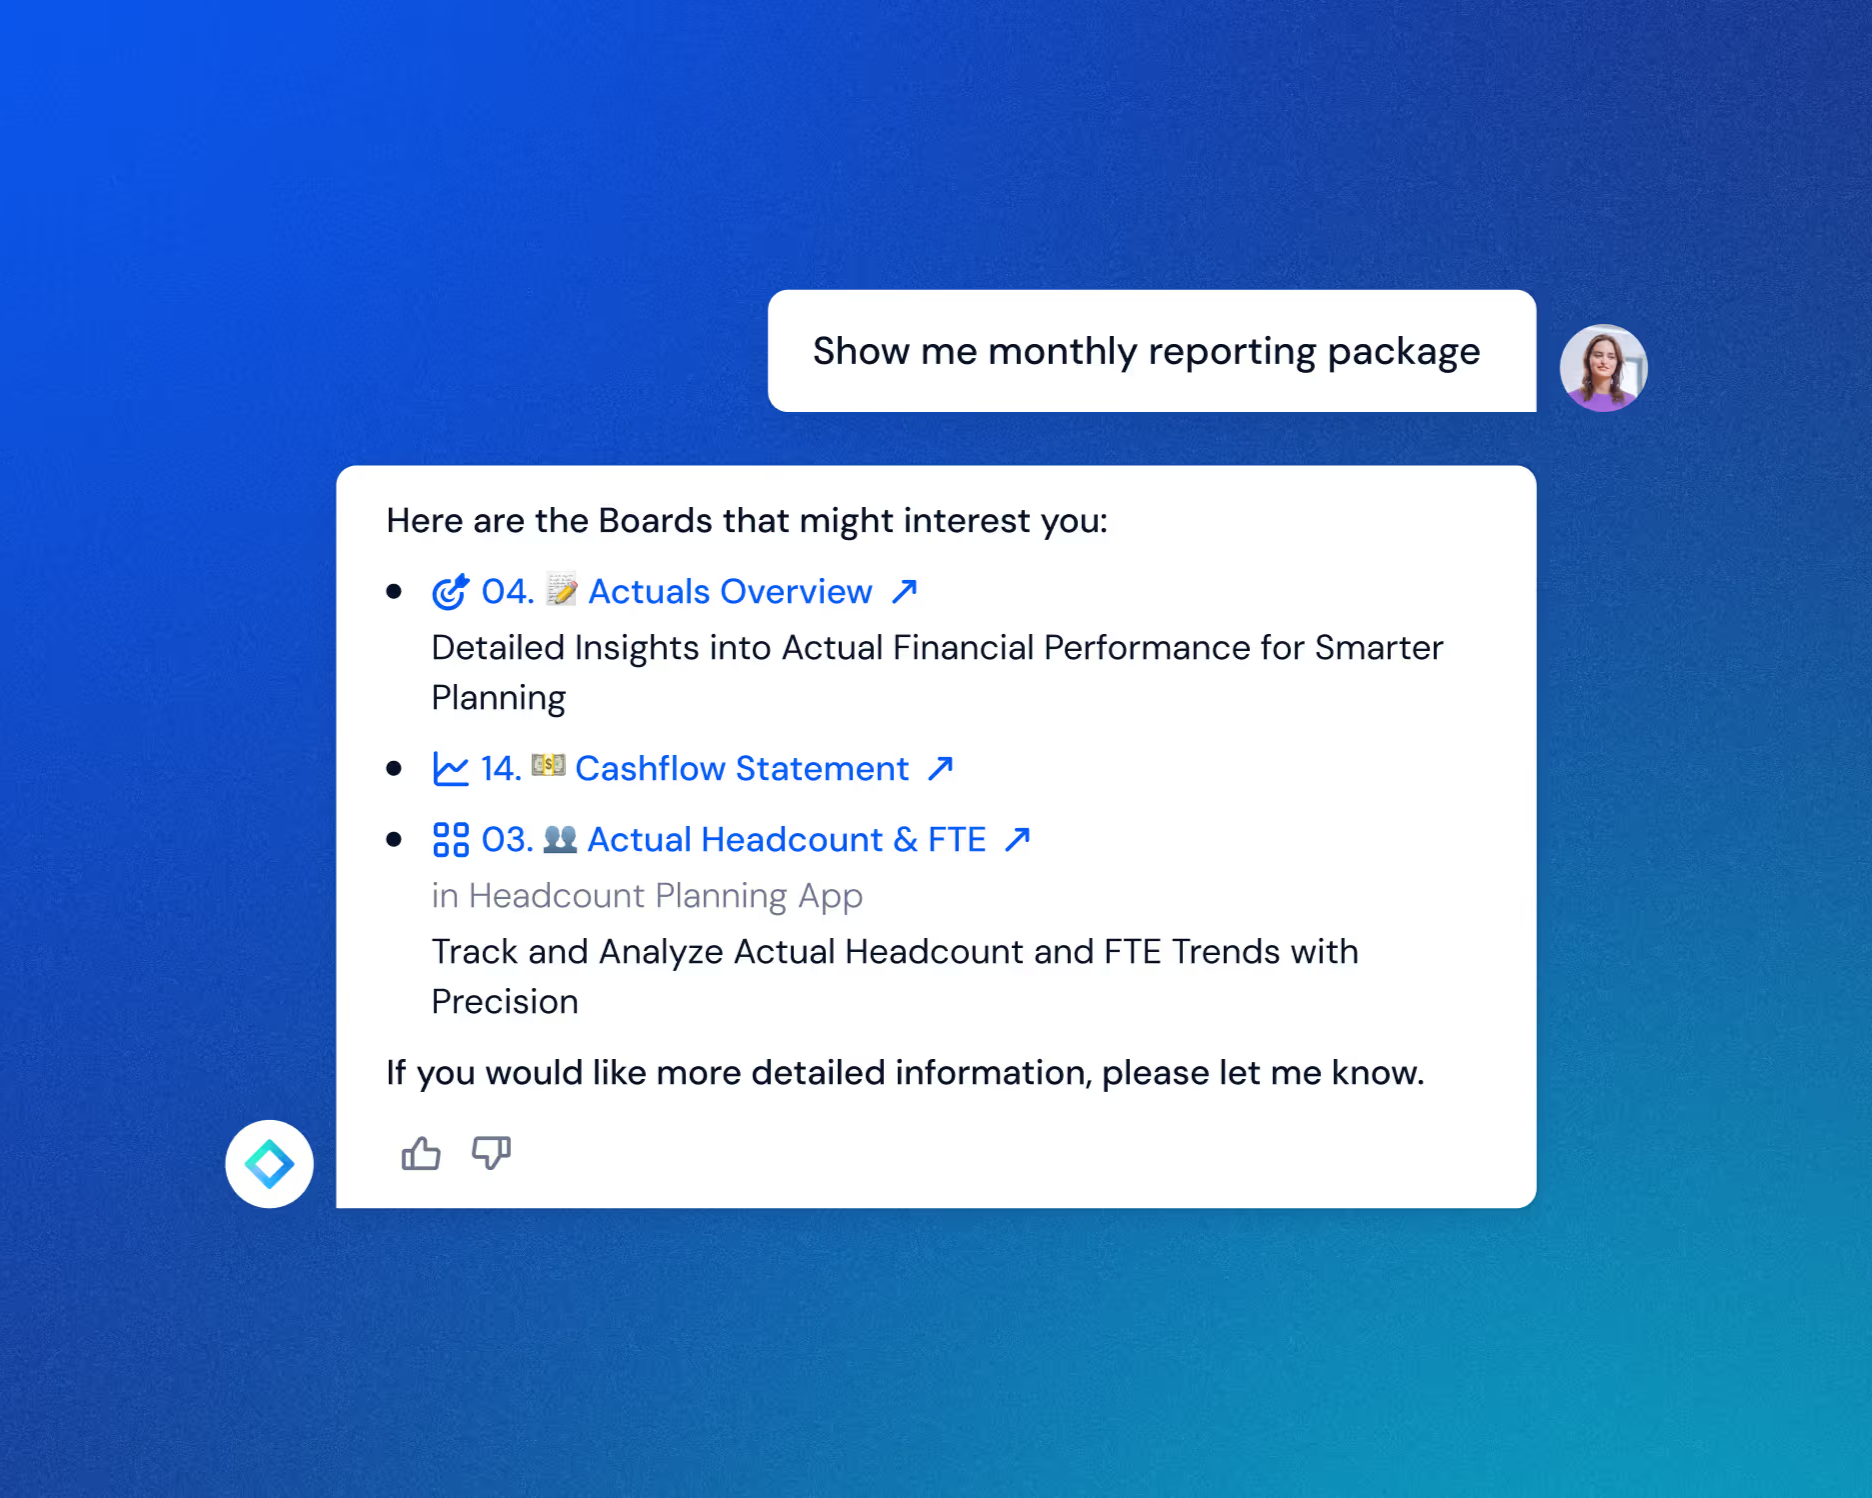
Screenshot of a chat conversation with a list of financial reporting boards and options to access detailed insights, including links and icons for navigation.

Step 1

Query the chatbot to find what you need
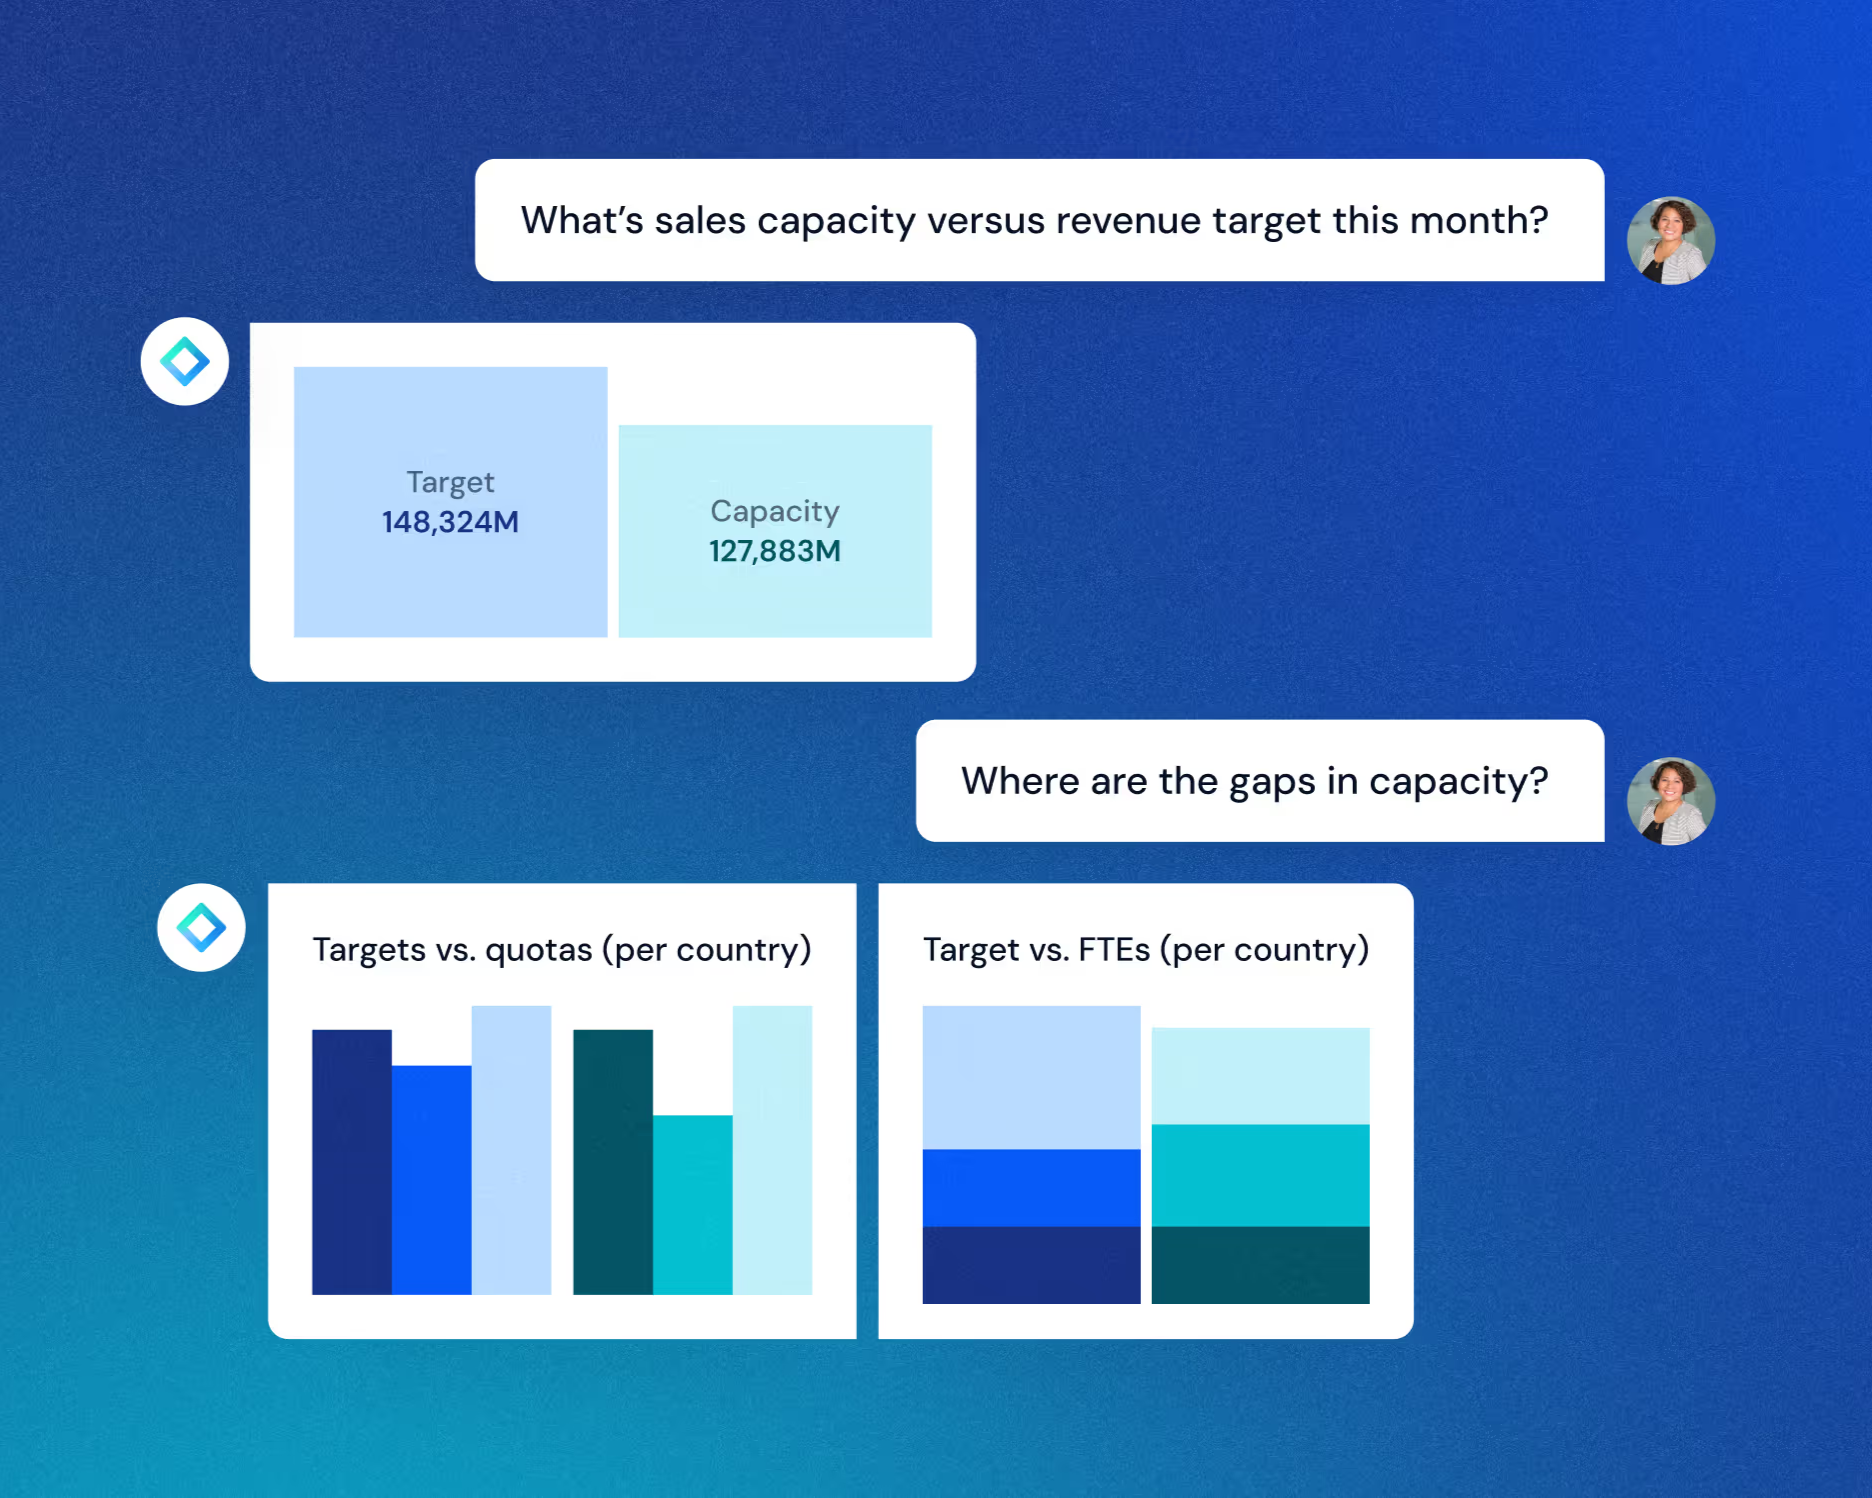
Cover of a blue report titled "Agentic AI Report, Wisdom of Crowds Series" by Dresner Advisory Services, LLC, dated August 21, 2025.
Digital presentation slide showing a conversation about sales data. The slide features a chart comparing targets and capacities, with text questions about sales capacity versus revenue, and gaps in capacity. Two smaller charts compare targets versus quotas and FTEs per country.

Step 2

Drill down into granular data
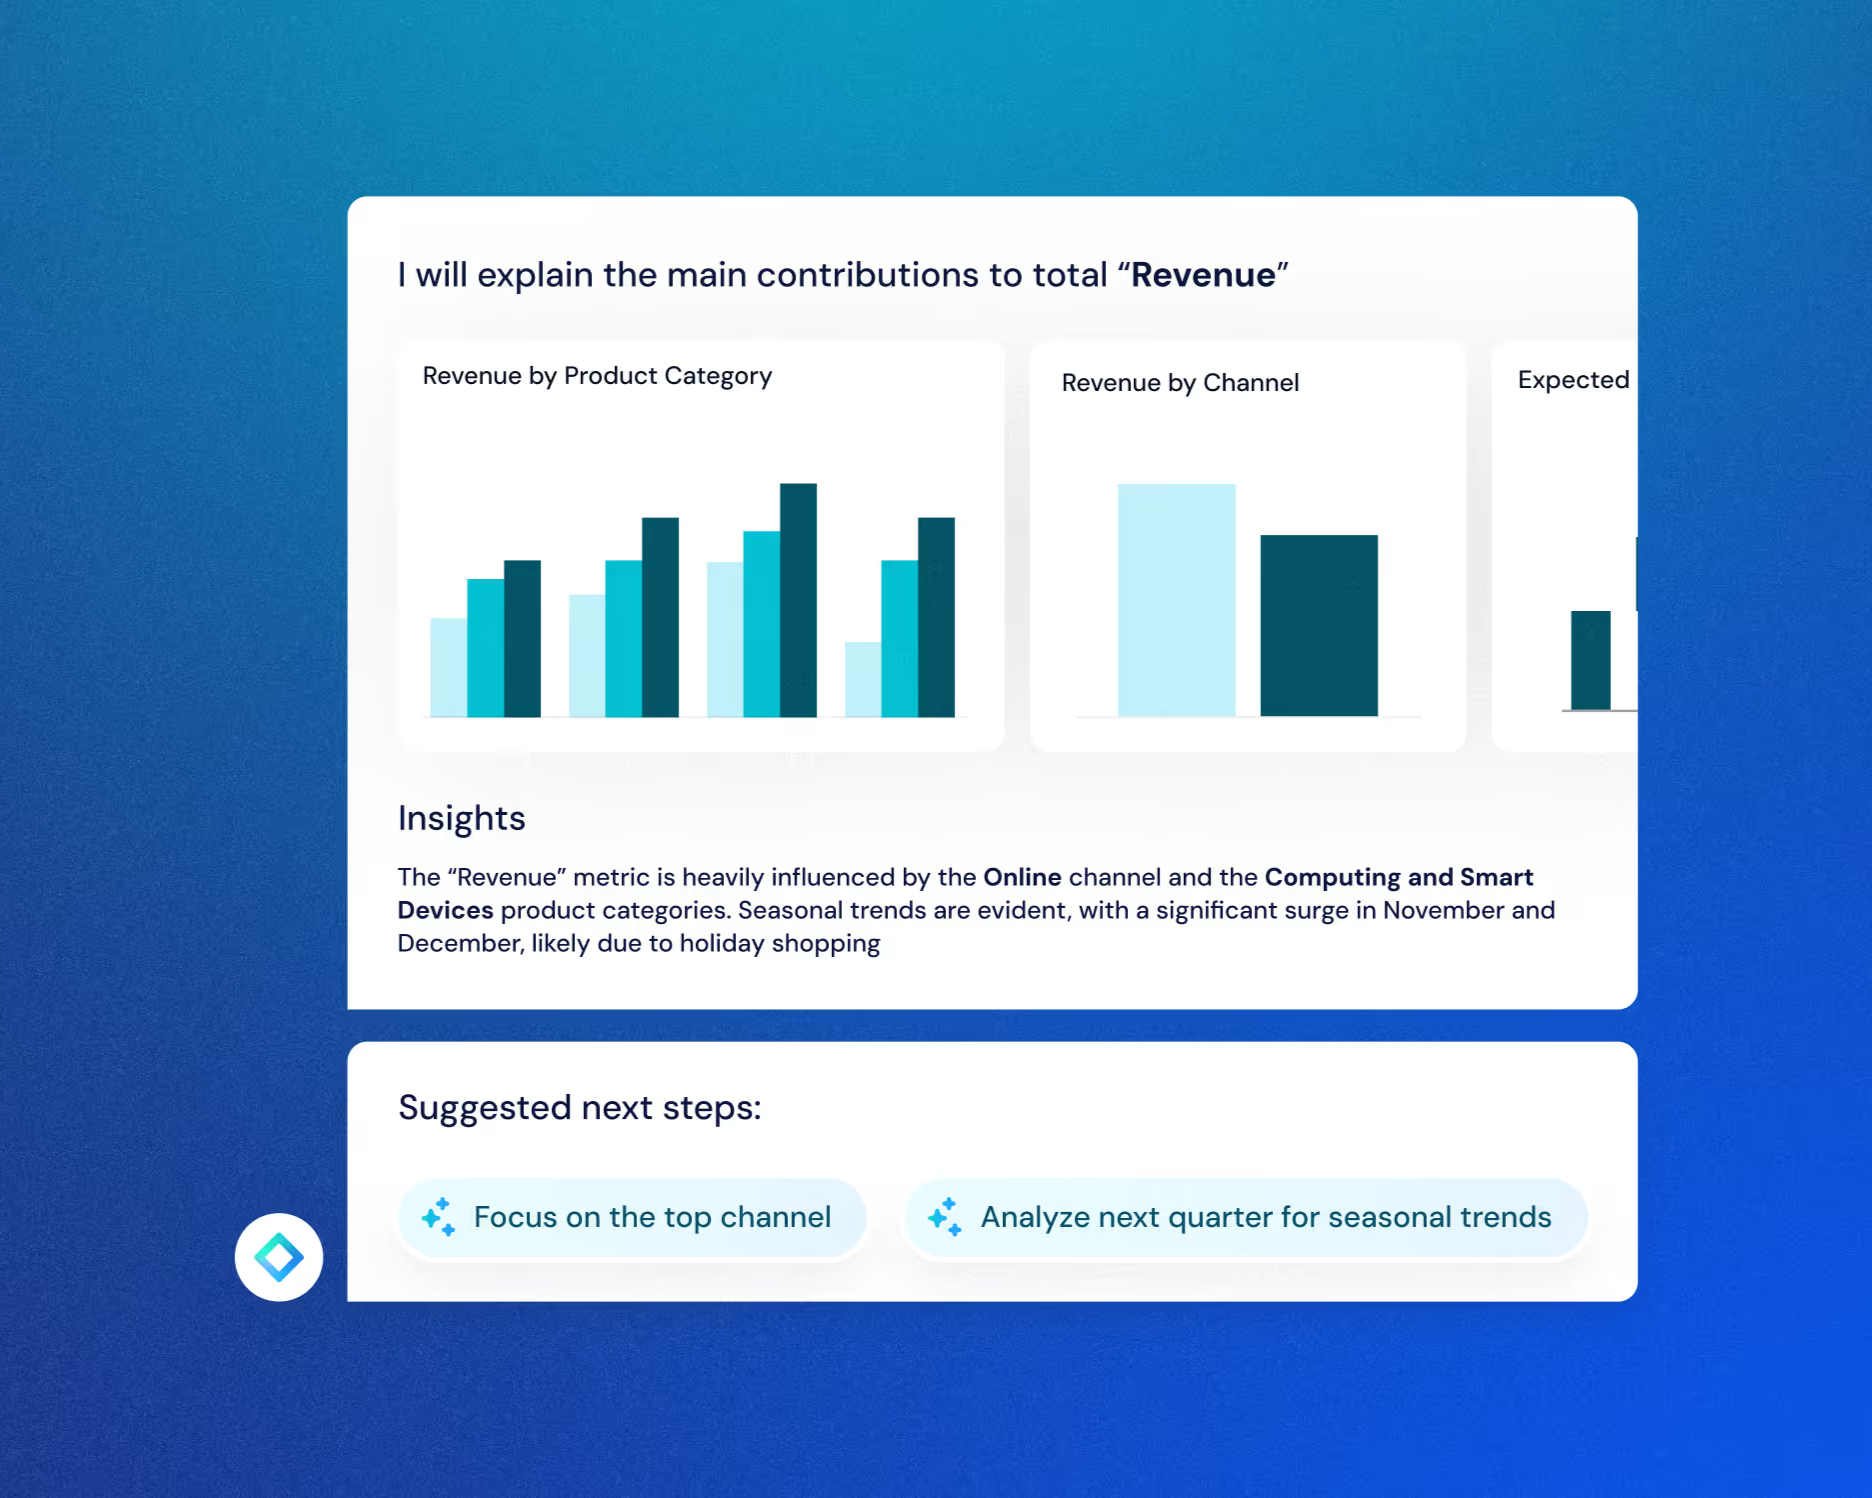
Screenshot of a presentation slide showing revenue analysis with bar charts, text boxes under 'Insights' and 'Suggested next steps', against a blue gradient background.

Step 3

Smart suggestions to support your next steps

More about Pigment

Explore how Pigment compares to other planning tools like Anaplan, TM1 or Workday Adaptive Planning

Learn more